
President Joe Biden has been very clear that one of his top priorities is accelerating the nation’s rollout of COVID vaccines, and he’s tapped former FDA chief David Kessler to lead the effort. As they step into their roles, where does America’s COVID vaccination drive stand?
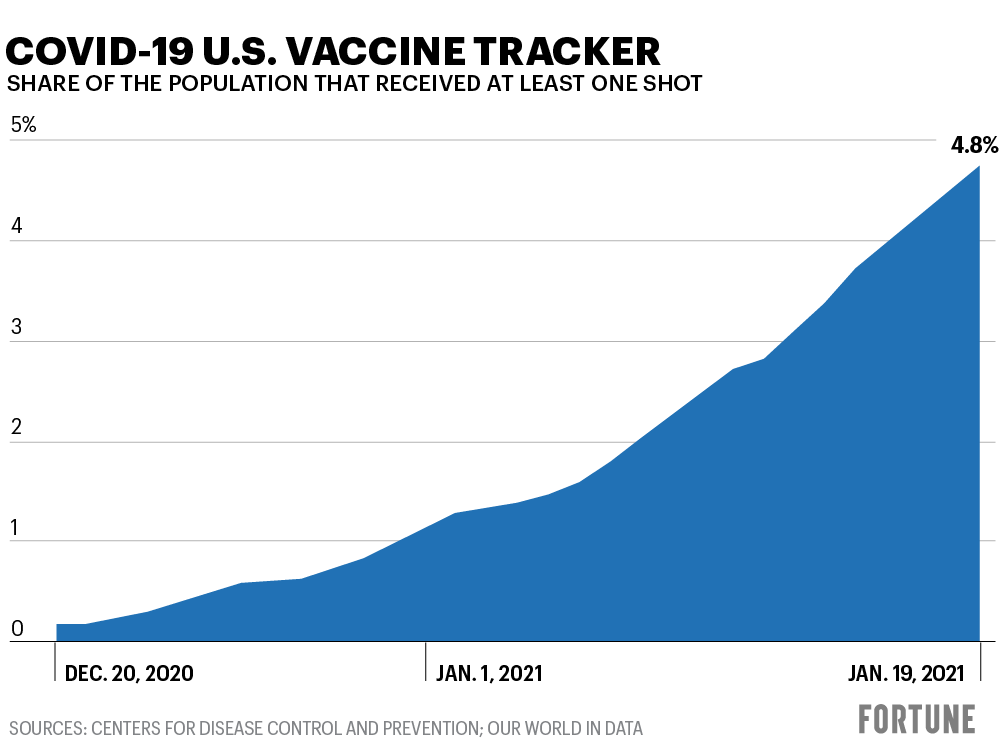
According to data from the Centers for Disease Control (CDC), 4.8% of the U.S. population had received at least one dose of the vaccine through Jan. 19, up from 2.8% a week ago. In total, roughly 15.7 million shots have been administered of the 31.2 million that had been distributed. Just over two million people have received both doses of vaccine.

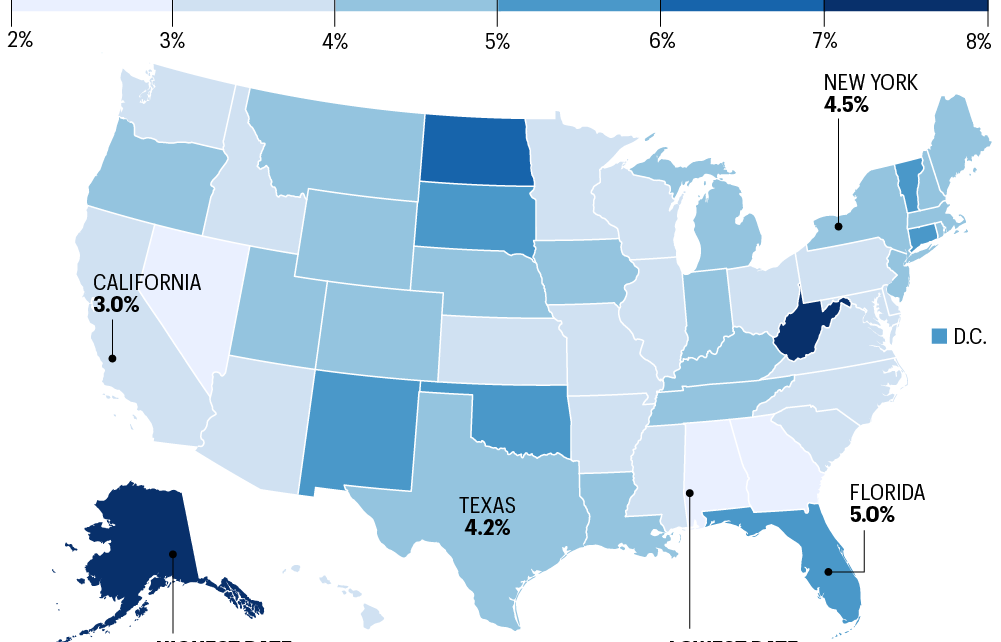
Of the states, Alaska has reached the largest percentage of its population with the vaccine so far, with 7.6% of its citizens having received at least one dose. West Virginia, last week’s leader, was the only other state where more than 7% of the population has received at least one dose of vaccine.
Alabama, Georgia, and Nevada have the lowest rates, each with less than 3% of the population having received a dose of one of the COVID vaccines. Alabama, which is the state that has so far reached the smallest percentage of the population in its rollout, has only administered 29% of the vaccine doses it has received.
Most of the vaccines have so far been administered by the states to their residents; just 1.7 million doses have been administered to Americans in long-term care facilities through the federal partnerships with pharmacies like CVS and Walgreens.
SHARE OF THE POPULATION THAT RECEIVED AT LEAST ONE SHOT
| State or territory | Share vaccinated |
| Alabama | 2.3% |
| Alaska | 7.6% |
| American Samoa | 7.2% |
| Arizona | 3.2% |
| Arkansas | 3.9% |
| California | 3% |
| Colorado | 4.8% |
| Connecticut | 5.7% |
| Delaware | 3.7% |
| District of Columbia | 5.6% |
| Florida | 5% |
| Georgia | 2.6% |
| Guam | 2.3% |
| Hawaii | 3.7% |
| Idaho | 3% |
| Illinois | 3.3% |
| Indiana | 4.2% |
| Iowa | 4.1% |
| Kansas | 3.5% |
| Kentucky | 4.5% |
| Louisiana | 4.8% |
| Maine | 4.7% |
| Maryland | 3.7% |
| Massachusetts | 4% |
| Michigan | 4.2% |
| Minnesota | 3.7% |
| Mississippi | 3.5% |
| Missouri | 3.1% |
| Montana | 4.4% |
| Nebraska | 4.6% |
| Nevada | 2.8% |
| New Hampshire | 4.7% |
| New Jersey | 4% |
| New Mexico | 5.4% |
| New York | 4.5% |
| North Carolina | 3.3% |
| North Dakota | 6.2% |
| Ohio | 3.8% |
| Oklahoma | 5.3% |
| Oregon | 4.6% |
| Pennsylvania | 3.6% |
| Puerto Rico | 3.4% |
| Rhode Island | 4.2% |
| South Carolina | 3% |
| South Dakota | 5.8% |
| Tennessee | 4.4% |
| Texas | 4.2% |
| Utah | 4.5% |
| Vermont | 5.5% |
| Virgin Islands | 1.9% |
| Virginia | 3.4% |
| Washington | 3.5% |
| West Virginia | 7.2% |
| Wisconsin | 3.2% |
| Wyoming | 4.3% |
More health care and Big Pharma coverage from Fortune:
- How to find out where and when you can get a COVID vaccine in your state
- The COVID-19 vaccination drive may be slow—but it’s already faster than any in history
- Commentary: How to help your employees cope with COVID-related work absences
- A British hospital network is using blockchain technology to track COVID-19 vaccines
- From a disillusioned youth precariat to state collapse—WEF ranks the risks to our post-COVID world